
Tax incidence shows who actually bears the burden of a tax — consumers or producers.
This is critical to understand for both 10-mark and 15-mark Paper 1 questions about government intervention.
The key rule (MUST REMEMBER)
The more inelastic side bears the greater tax burden.
- Inelastic demand → consumers pay more of the tax
- Inelastic supply → producers pay more of the tax
Why? The logic
Inelastic means less responsive. When demand is inelastic, consumers can't easily switch to alternatives — they have to keep buying. So they can't avoid the tax. Producers can force them to pay more.
Elastic demand means consumers CAN switch. If a producer tries to pass on the tax by raising price, consumers buy less or switch to rivals. So the producer absorbs the tax, not the consumer.
On the diagram
When the government imposes an indirect tax (like VAT), the supply curve shifts upward by the amount of the tax.
- Pc = price consumers pay (higher)
- Pp = price producers receive (lower)
- Tax revenue = (Pc − Pp) × Qt (the shaded rectangle)
The vertical distance between Pc and Pp is the tax. The bigger the gap is borne by consumers (vertical distance from Pp to the old price), the more the tax hits them.
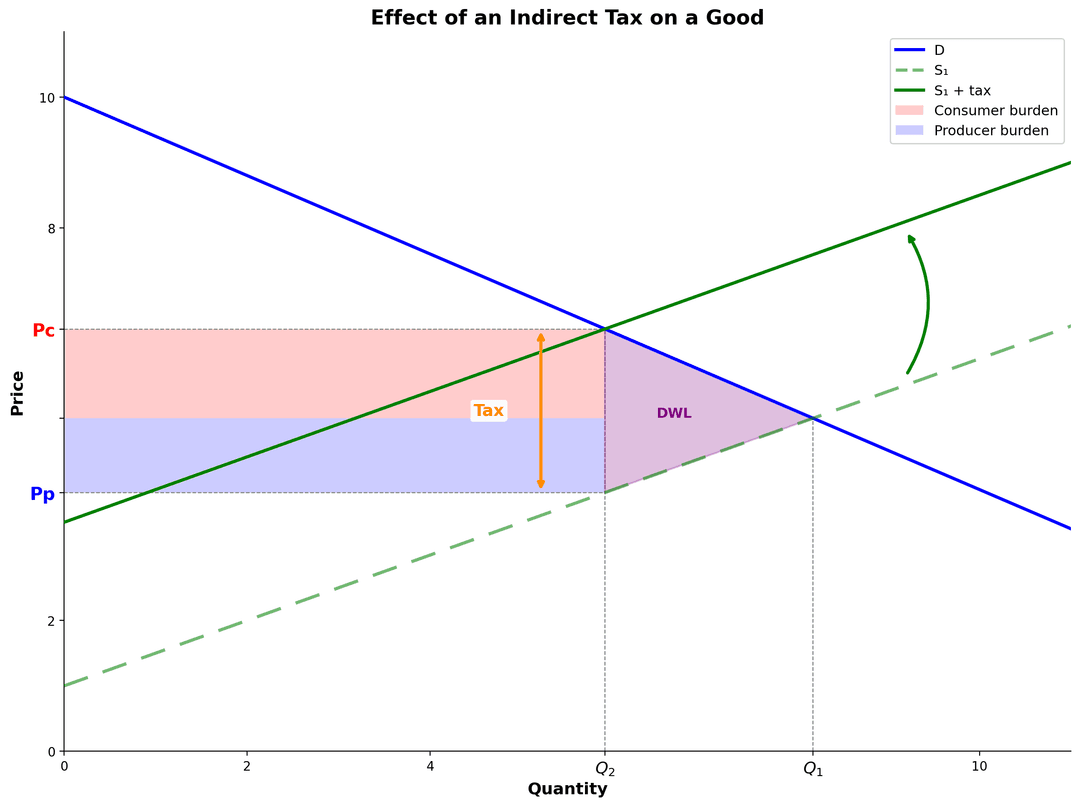
Reading the diagram: The top part of the tax rectangle (above the old equilibrium price) is borne by consumers. The bottom part is borne by producers. Inelastic demand = taller demand curve = more of the rectangle sits above the old price = consumers bear more.
Real-world example: Cigarettes
Cigarettes face a high tax in most countries. Why? Because demand for cigarettes is inelastic:
- Smokers are addicted
- Few substitutes exist
- They will keep buying even if price rises
So when governments tax cigarettes, most of the tax falls on consumers — not producers. Consumers pay significantly more; producers' margins shrink less.
Compare this to luxury goods (elastic demand). If a luxury item is taxed heavily, consumers can easily stop buying it → producers absorb more of the tax or the quantity falls dramatically.
Exam tip for 15-mark evaluation questions
When a question asks you to evaluate a tax policy:
- Analyse tax incidence using elasticity
- Explain who it affects most (low-income earners if demand is inelastic)
- Evaluate fairness: a tax that hits poor people disproportionately is regressive
The supply curve always shifts
A common exam mistake: drawing the demand curve shifting instead of the supply curve. The tax is imposed on producers (or collected from them), so it's the supply curve that shifts upward.
Why upward? Because for any given quantity, producers now need a higher price to cover their costs + the tax. The curve moves up by the exact amount of the tax per unit.
The triangle: deadweight loss
The triangle to the right of the new equilibrium shows the loss of beneficial trades. Some transactions that would have happened at the old price no longer happen. This is welfare loss — the main disadvantage of taxation.
More IB Economics guides
Build your IB Economics revision cluster
Need more than one article? Explore the IB Economics study hub or browse all IB Economics blog posts so your practice, revision, and exam technique all connect.
Ready to put your IB knowledge to the test?
Try a full-length mock exam with real IB-style questions and instant marking — or browse our question bank to practise topic by topic.