
Deadweight loss (DWL) is one of the most important concepts in IB Economics. It appears in almost every 15-mark question about government intervention.
What is deadweight loss?
Deadweight loss is the loss of total surplus when a market is not in equilibrium — i.e., when beneficial trades that WOULD happen at equilibrium don't happen.
Think of it as lost opportunities: trades that would make someone better off without making anyone worse off — but they can't happen because of the market intervention.
Simple way to understand it
"Trades that should happen — but don't, because of the intervention."
At equilibrium (Q1), every trade is mutually beneficial. Consumers who value the product more than the market price buy it. Producers with costs below the market price sell it.
When a tax, price ceiling, or subsidy moves quantity away from Q1, some of these beneficial trades disappear. The value lost is the DWL.
Where is it on the diagram?
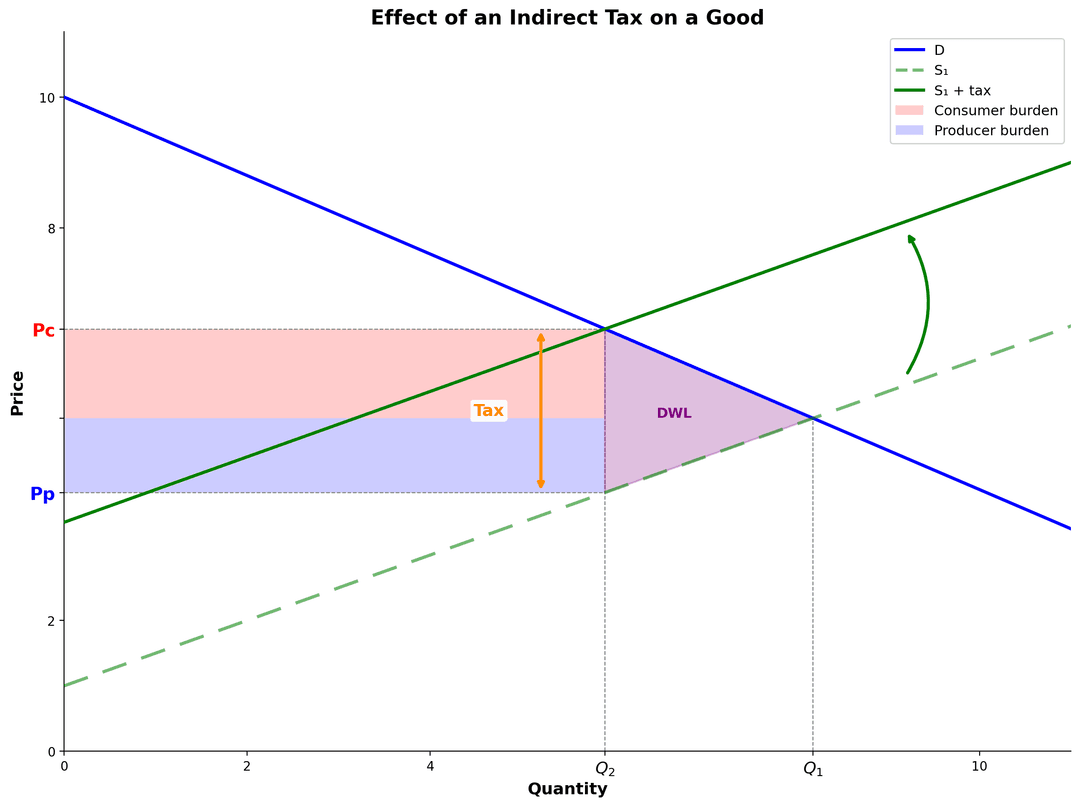
The DWL is always a triangle between the supply and demand curves, starting from the new quantity and extending right to where the original quantity would be.
- For a tax: Triangle to the right of new quantity, between S+tax and D
- For a price ceiling: Triangle above the ceiling price, between D and S
- For a price floor: Triangle below the floor price, between D and S
Why does deadweight loss happen?
When price moves away from equilibrium, two things happen:
- Quantity changes. Price goes up → quantity demanded falls. Price goes down → quantity supplied falls. Either way, quantity moves away from equilibrium.
- Beneficial trades disappear. Consumers willing to buy at the new price are fewer. Producers willing to sell at the new price are fewer. So fewer trades happen.
For every unit between the old and new quantity, the value to consumers (shown by the demand curve height) exceeds the cost to producers (shown by the supply curve height). These are transactions that SHOULD happen economically — but don't.
Real-world example: Plastic bags tax
Many cities have taxed or banned plastic bags. This reduces quantity from Q1 to Q2.
For units between Q2 and Q1, consumers valued the bag more than the cost to make it — but they don't buy because the tax raised the price. These lost transactions are the DWL. The loss of human convenience and time (searching for alternatives) and the producer surplus lost are the welfare costs.
Key insight: Size of DWL depends on elasticity
The bigger the elasticity, the bigger the DWL:
- Elastic demand → quantity falls a lot → bigger DWL triangle
- Inelastic demand → quantity falls less → smaller DWL triangle
This is why taxes on inelastic goods (tobacco, fuel) create less DWL than taxes on elastic goods (luxury items). Fewer trades are lost.
Exam language
When you see DWL on a diagram and need to explain it in an exam:
"The triangle between [curves] represents deadweight loss. These are units where the value to consumers (shown by the height of the demand curve) exceeds the cost to producers (shown by the height of the supply curve), but these trades don't happen because quantity has fallen below the socially optimal level."
Evaluation gotcha: Not all DWL is bad
In a 15-mark evaluation, students often say: "Taxes cause DWL, so they're bad."
That's incomplete. A better evaluation considers:
- DWL is a cost of the tax, but the benefit may outweigh it (e.g., correcting externalities)
- If the tax corrects a bad externality, the DWL is less than the original welfare loss
- Tax revenue might fund public goods that create more welfare than the DWL lost
Top-band answers weigh both sides: acknowledge the DWL loss, but explain when it's justified by the benefits.
More IB Economics guides
Build your IB Economics revision cluster
Need more than one article? Explore the IB Economics study hub or browse all IB Economics blog posts so your practice, revision, and exam technique all connect.
Ready to put your IB knowledge to the test?
Try a full-length mock exam with real IB-style questions and instant marking — or browse our question bank to practise topic by topic.